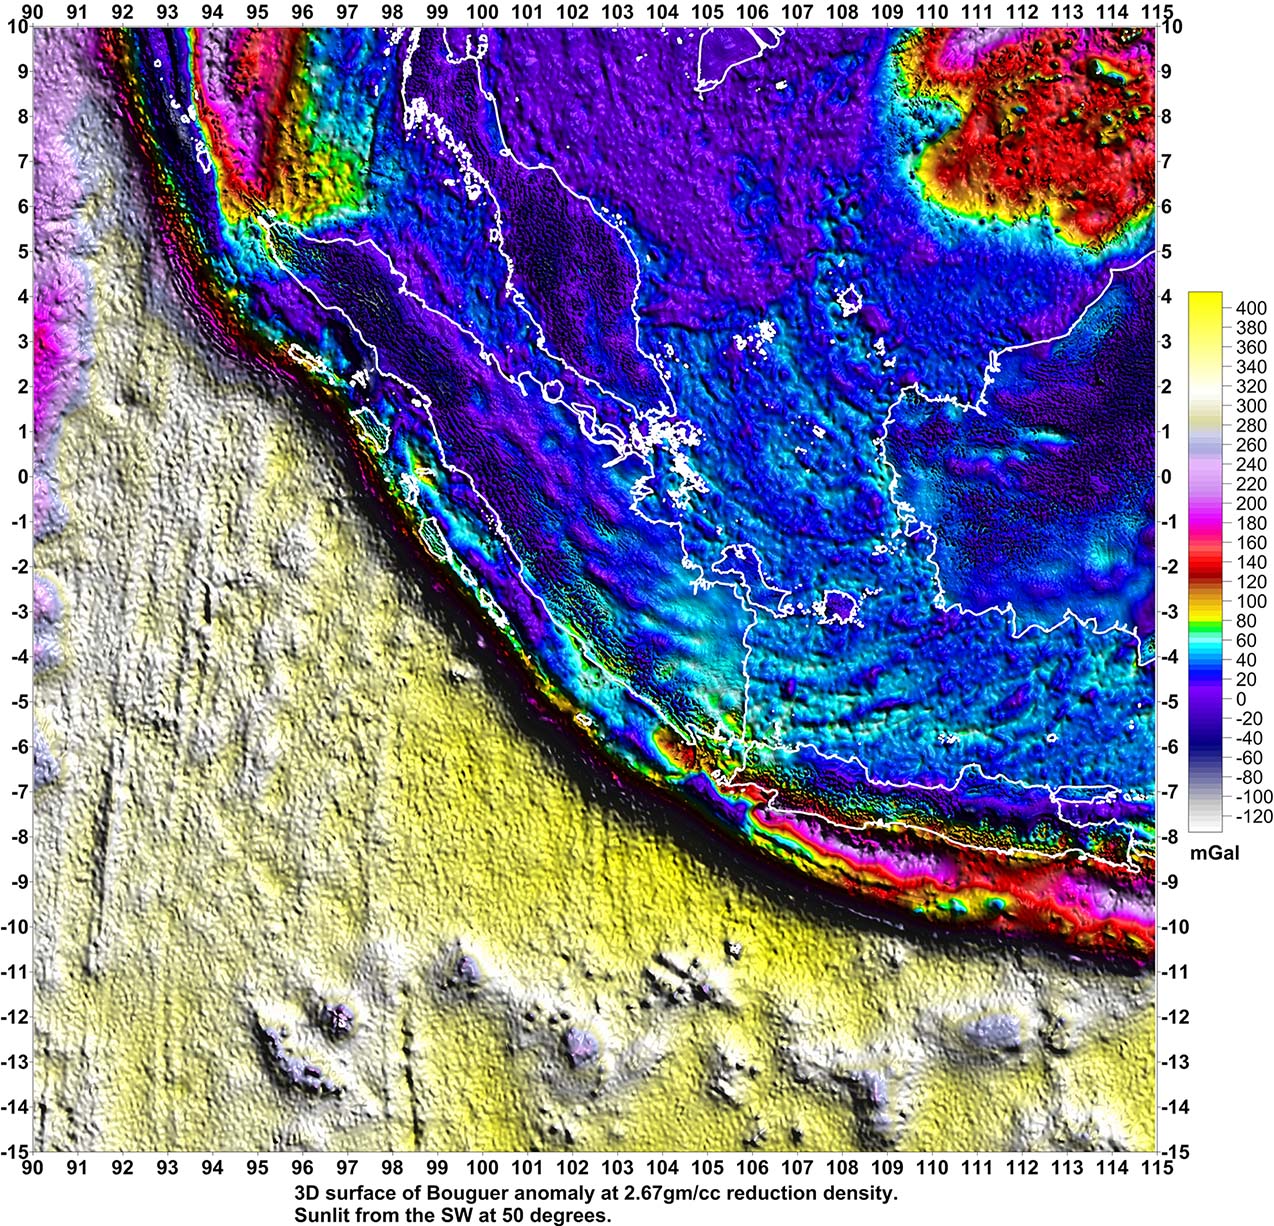
The image above is of the Bouguer anomaly (2.67gm/cc) of the area north of Sumatra and the Nicobar Islands. Clicking on the image will open an image for the whole study area.
Gravity Lineaments of Sumatra, Java and Borneo, Western Indonesia
Summary
This study of gravity lineaments in Western Indonesia shows faults and other geological features resulting from density contrasts within and between combined Bouguer anomaly surfaces computed using different reduction densities. The area covered includes Sumatra, Java, the Malayan Archipelago, and western Borneo.
The images on this page were created by producing a number of complete Bouguer anomaly surfaces at different reduction densities. The reduction densities ranged from 0.10gm/cc (close to the free-air anomaly), through the standard crust reduction density of 2.67gm/cc and then to 3.4gm/cc. Each surface was then examined for linear features, each feature being colour-coded for the reduction density used. Each set of linear features was then combined to produce the multi-coloured images on this page.
The colour scheme starts with red for shallow depth features, then passes through yellow to green and finally into increasingly darker blues for features at the greatest depth. Depth, in this instance, is a relative term.
In combination these coloured strings portray the likely locations of subduction zones/traces, faults, thrusts, volcanoes, horsts and grabens and many other geological features that give rise to a density contrast. Additionally, the combination of strings, resulting from low to high reduction densities (0.10 to 3.4gm/cc), creates a semi-planar surface that gives an indication of how the focii of density contrasts varies with depth, for example, some fault planes show the direction of dip.
The following images have been tuned to show the long-wavelength features in marine areas. The images are typically larger than 2 megabytes and, even then, are much degraded versions of the originals.
Please read the caveats at the bottom of this page.
Please note that the gravity data have not been reduced to the ellipsoid, as have the Eastern Indonesian data; consequently gravity surfaces from the two areas do not match - there is a datum shift between the two.

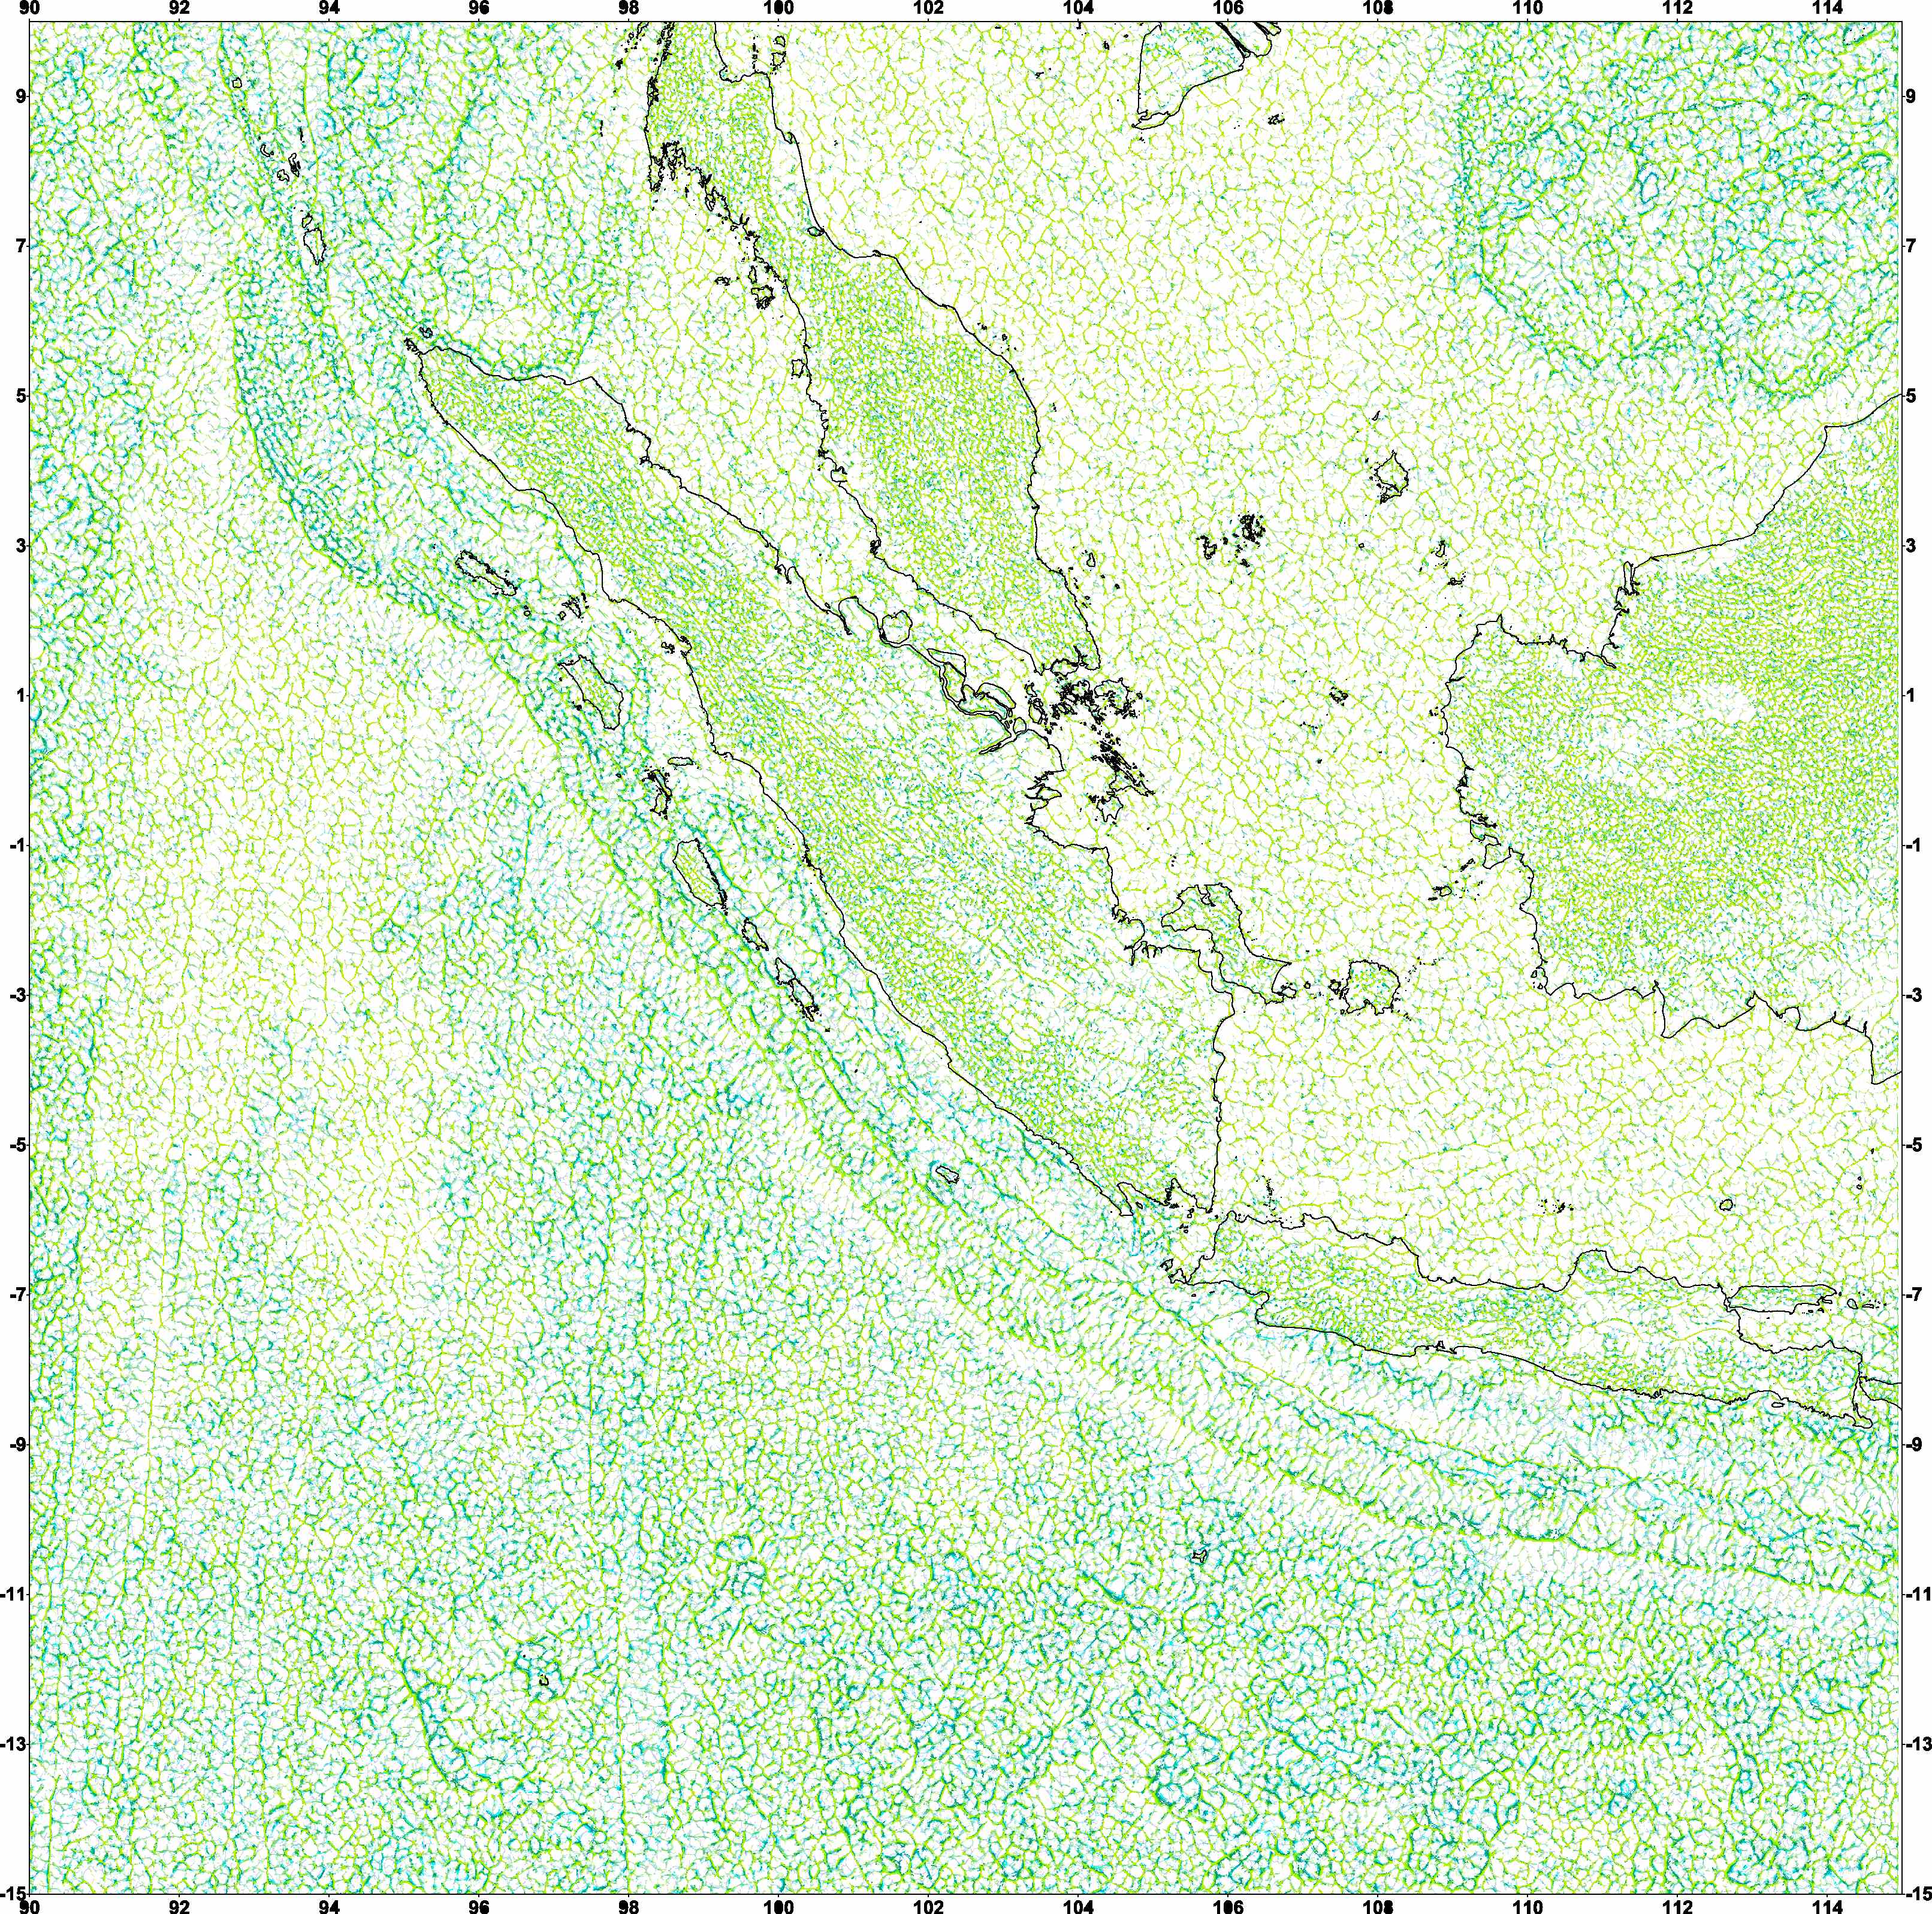
The image above is of simplified gravity lineaments overlying a grey scale image of the Bouguer anomaly surface for the area between Sumatra and Java. Clicking on the image will open an image for the whole study area.

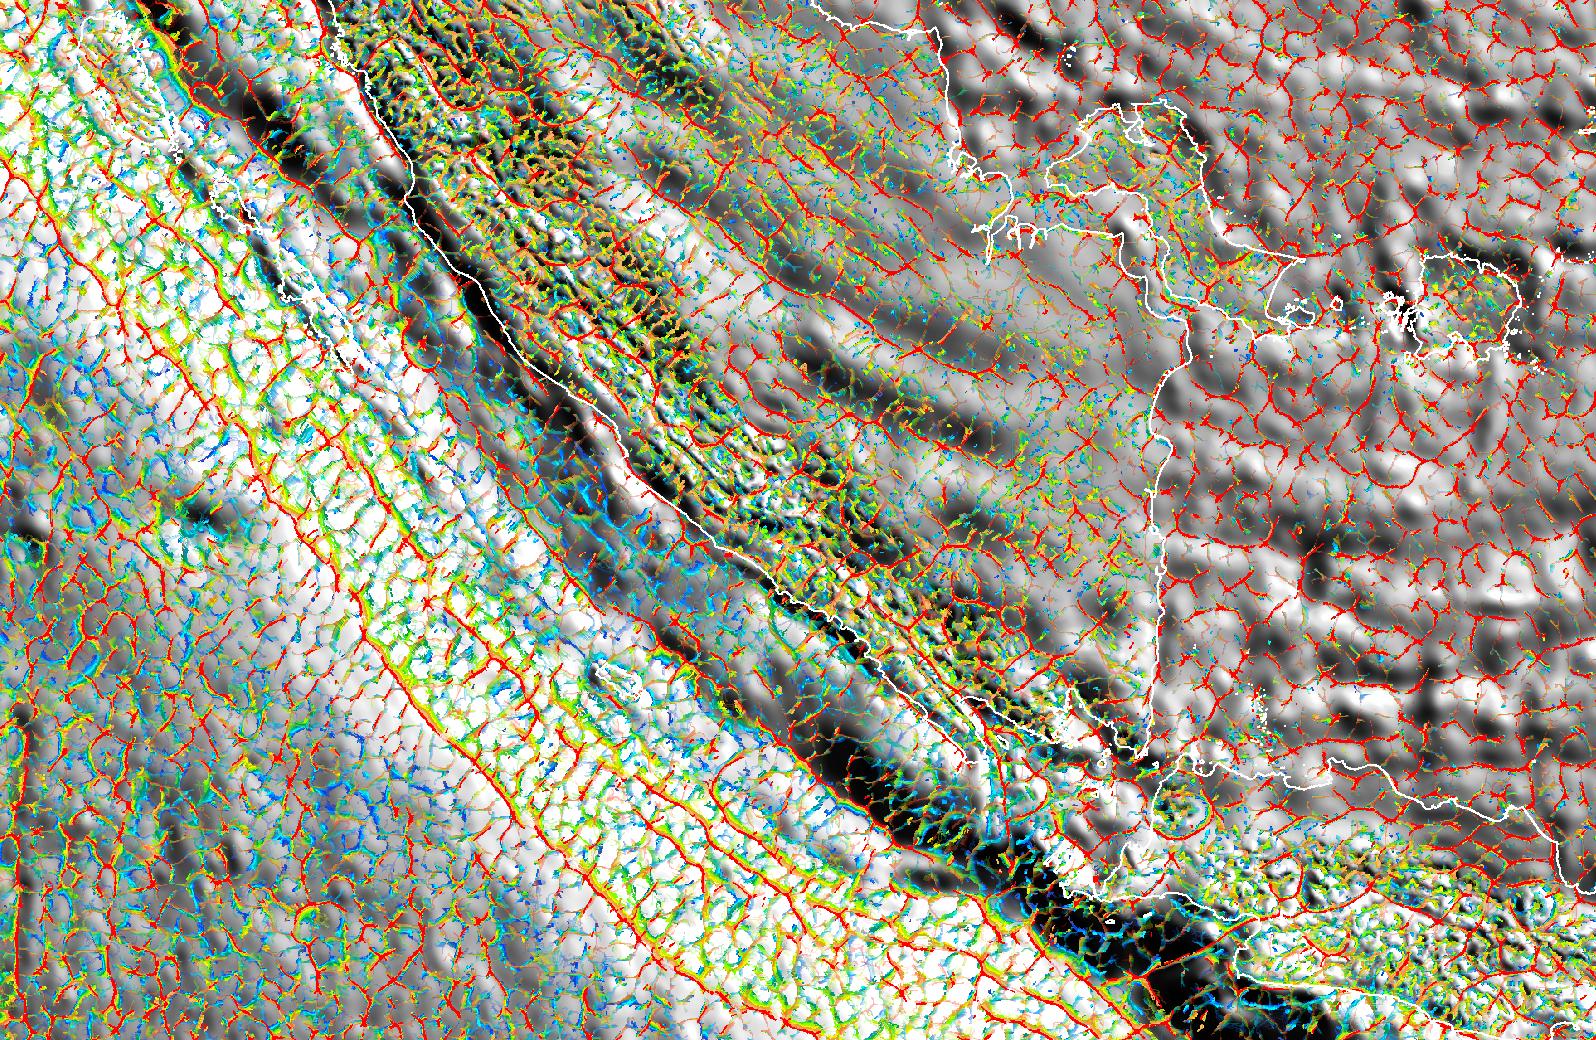
The image above is of a combined set of lineaments, colour coded as described above, for the area around the island of Nias. Click on the image to open a larger image for the whole study area (2.59meg). Background colour is black.

North Sumatra and Nicobar Islands
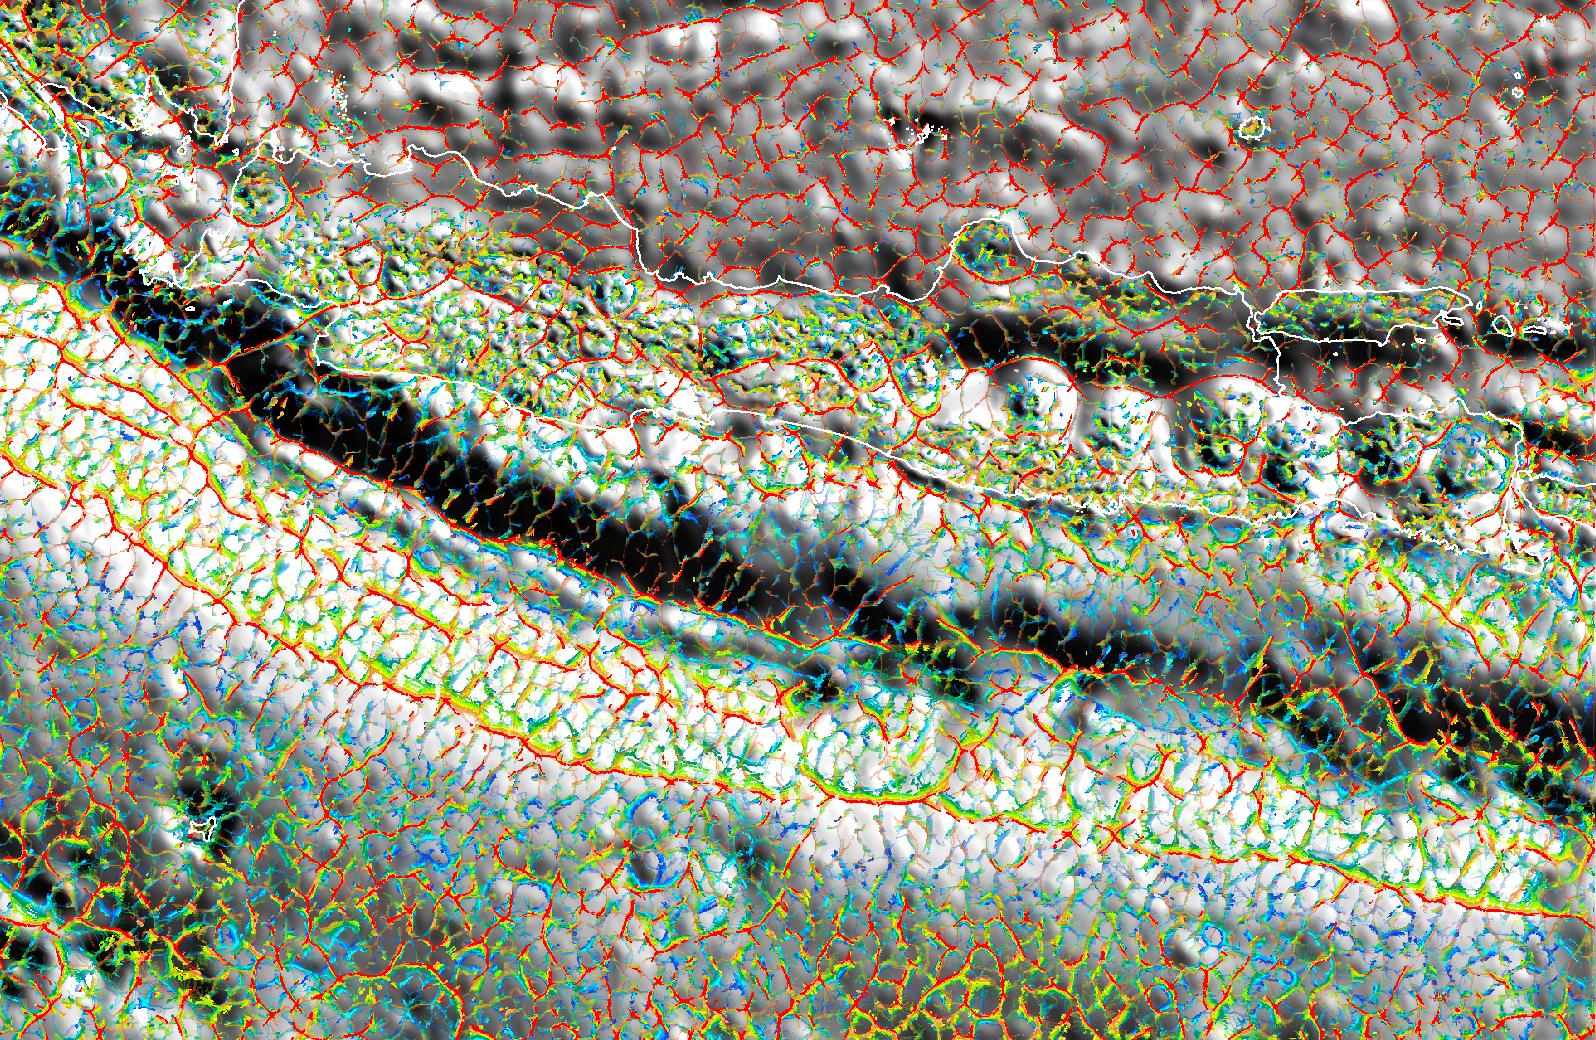
The image above is similar to that above but for the area north of Sumatra and the Nicobar Islands. Click on the image to open a larger image for the whole study area (2.73meg). Background colour is white.

The image above is comprised of the same lineaments as that above but they have been allowed to cumulatively combine. One result is black lines where multiple Bouguer lineaments overlie each other. The level of blackness is indicative of the total depth of the geological boundary and/or how vertical the boundary is. Conversely, known thrust planes do not show as black. Elsewhere, the black lines overlie deeper coloured lines (typically greens and blues) suggesting discontinuity between shallow and deeper tectonic regimes. Click on the image to open a larger image for the whole study region (2.63meg). Background colour is white.

North Sumatra
The image above is of a combined set of lineaments, colour coded as described above, for the area north of Sumatra. Click on the image to open a detailed image for Northern Sumatra (816kb). Background colour is black.

Mid-Sumatra
The image above is colour coded as described above, for the area around the island of Nias. Click on the image to open a detailed image for mid- Sumatra (851kb). Background colour is black.
South Sumatra
The image above is colour coded as described above, for the area around the island of Enggano. Click on the image to open a detailed image for Southern Sumatra (826kb). Background colour is black.
Java
The image above is colour coded as described above, for mid-Java. Click on the image to open a detailed image for Java (832kb). Background colour is black.

Deep-level Gravity Lineaments
The image above is of Northern Sumatral and shows only the deeper level lineaments in blue. The following two images are for the medium and shallow levels. Amongst other benefits, examining each may help identify shallow faults from deeper seated faults. Click on the image to open a larger image for the whole study region (2.5meg). Background colour is white.
Mid-level Gravity Lineaments
The image above is of the area between Sumatra and Java and shows only the medium level lineaments in yellows and greens. Click on the image to open a larger image for the whole study region (2.34meg). Background colour is white.

Shallow-level Gravity Lineaments
The image above is of the southern Malay Peninsular and shows only the shallow level lineaments in reds and yellows. This image is closest to the classical free-air anomaly and shows major lineaments relating to significant topographic features. Click on the image to open a larger image for the whole study region (2.19meg). Background colour is white.
Caveats:
- The usual warnings of non-uniqueness of the gravity method apply.
- The lineaments have been produced from grids of 0.00555 arc degrees but the original gravity and topography grids had a resolution of 0.01667 arc degrees (1 minute of arc). Images on this site are degraded from the originals.
- Some geophysicists think it inappropriate to replace sea-water with rock, i.e. applying a Bouguer correction to marine areas. They may also think that to then combine multiple Bouguer surfaces is even worse. This author takes a pragmatic view - if the results are beneficial and allow a greater understanding of this under-resolved region, so much the better.
- The method has been tuned to primarily show large, long-wavelength features from the marine areas..
- Satellite derived gravity measurements are unreliable in water depths shallower than 200-300 metres and for bathymetric features with a wavelength shorter than approximately 15Kms. These limitations essentially produce an unknown and immeasurable level of noise on top of longer wavelength bathymetric features.
- Bathymetric shiptrack data have not been removed from the satellite topography grids used to produce the complete Bouguer correction. Consequently some lineament features will be caused by these data.
- Edge effects have not been removed, hence the red, thick border to many images.